
Turn
your data into clear decisions
Interactive dashboards that transform complex information into real-time insights, so you can monitor progress and act with confidence
Discuss Your Dashboard Needs
What we build
Dashboard Capabilities
Performance Monitoring
Track KPIs, operational metrics, project milestones, and performance trends in one live environment.
Data Visualization
Turn dense datasets into clear charts, maps, and visual summaries that decision-makers can actually use.
Power BI Dashboards
Connect structured reporting with modern BI tools for advanced filtering, slicing, and executive reporting.
Custom Web Dashboards
Build branded, client-facing dashboards tailored to workflows, teams, and operational logic.
Interactive Data Dashboards
Transform complex data into clear insights with powerful interactive dashboards designed for teams, executives, and organizations that need better visibility.
Take a look at our live dashboards
Browse real dashboards we've delivered for clients — click through any preview to open the live, interactive version.
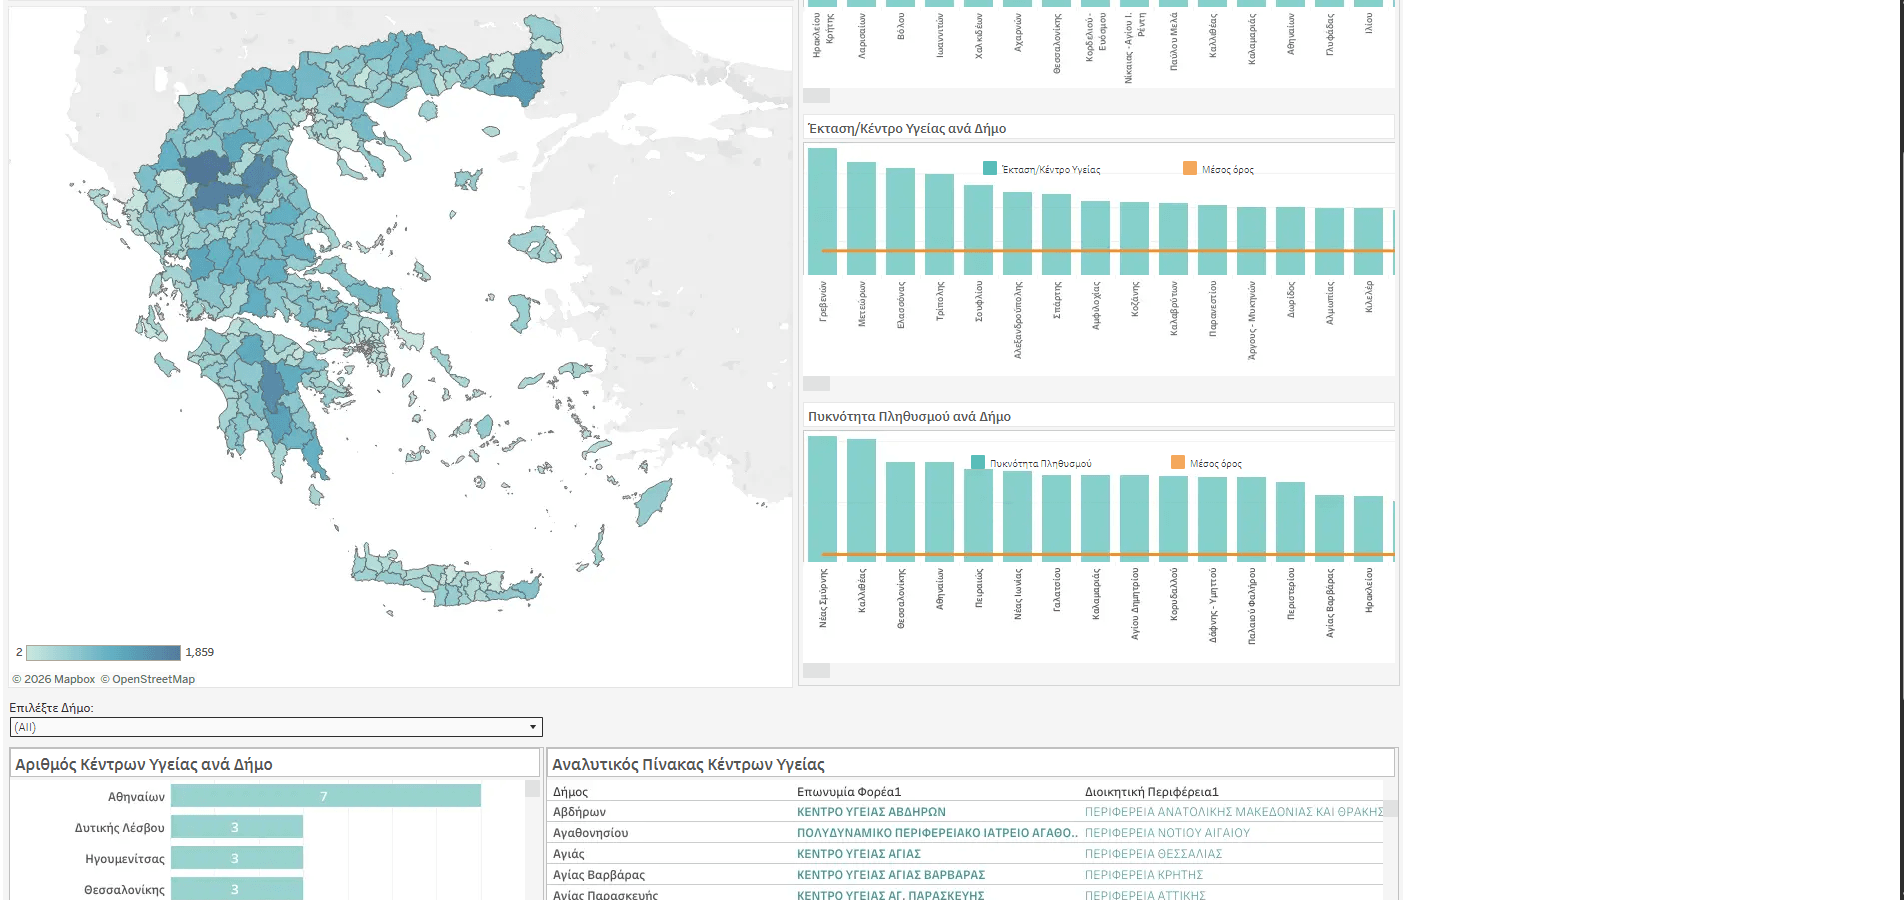
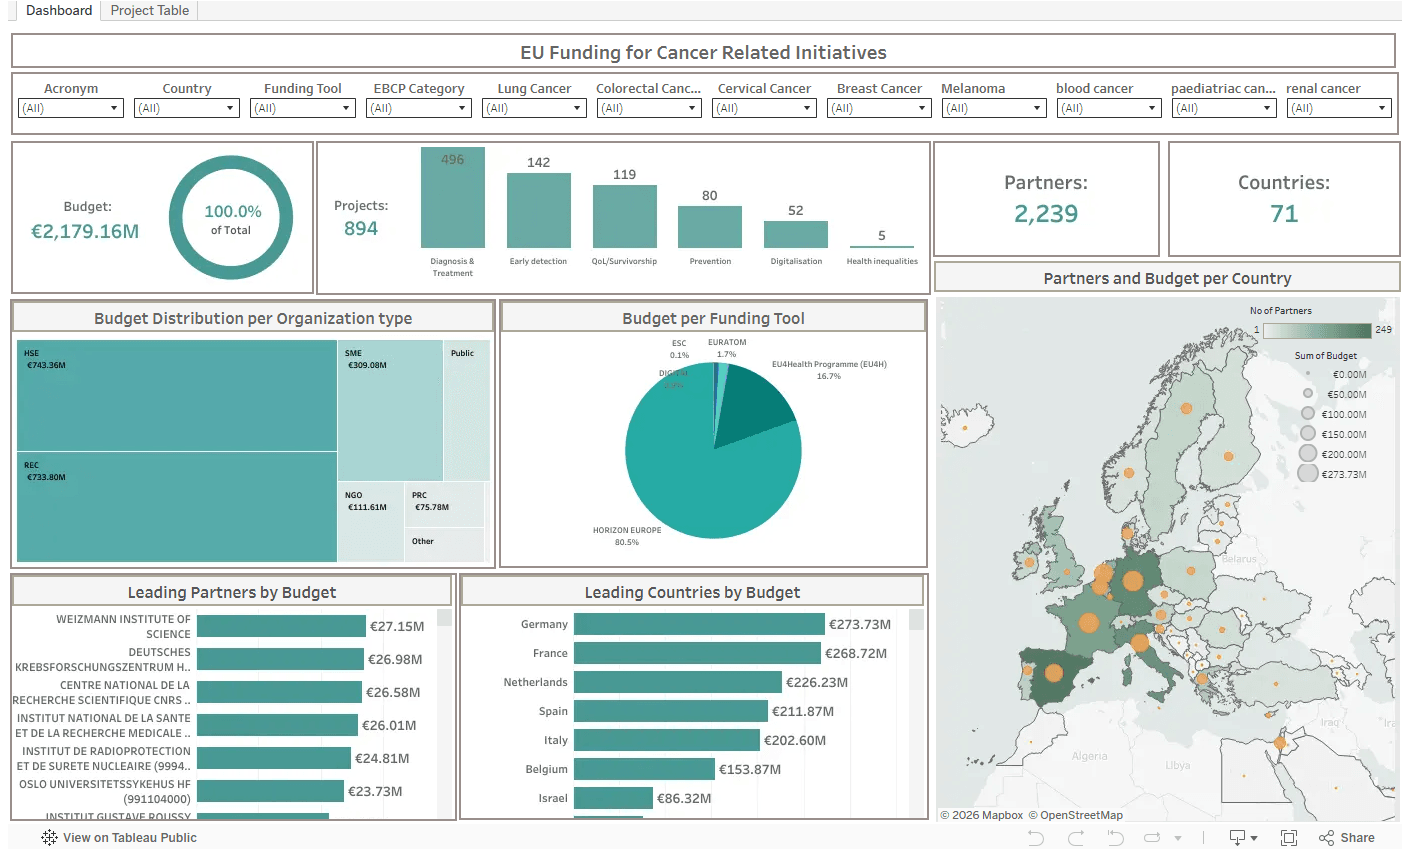
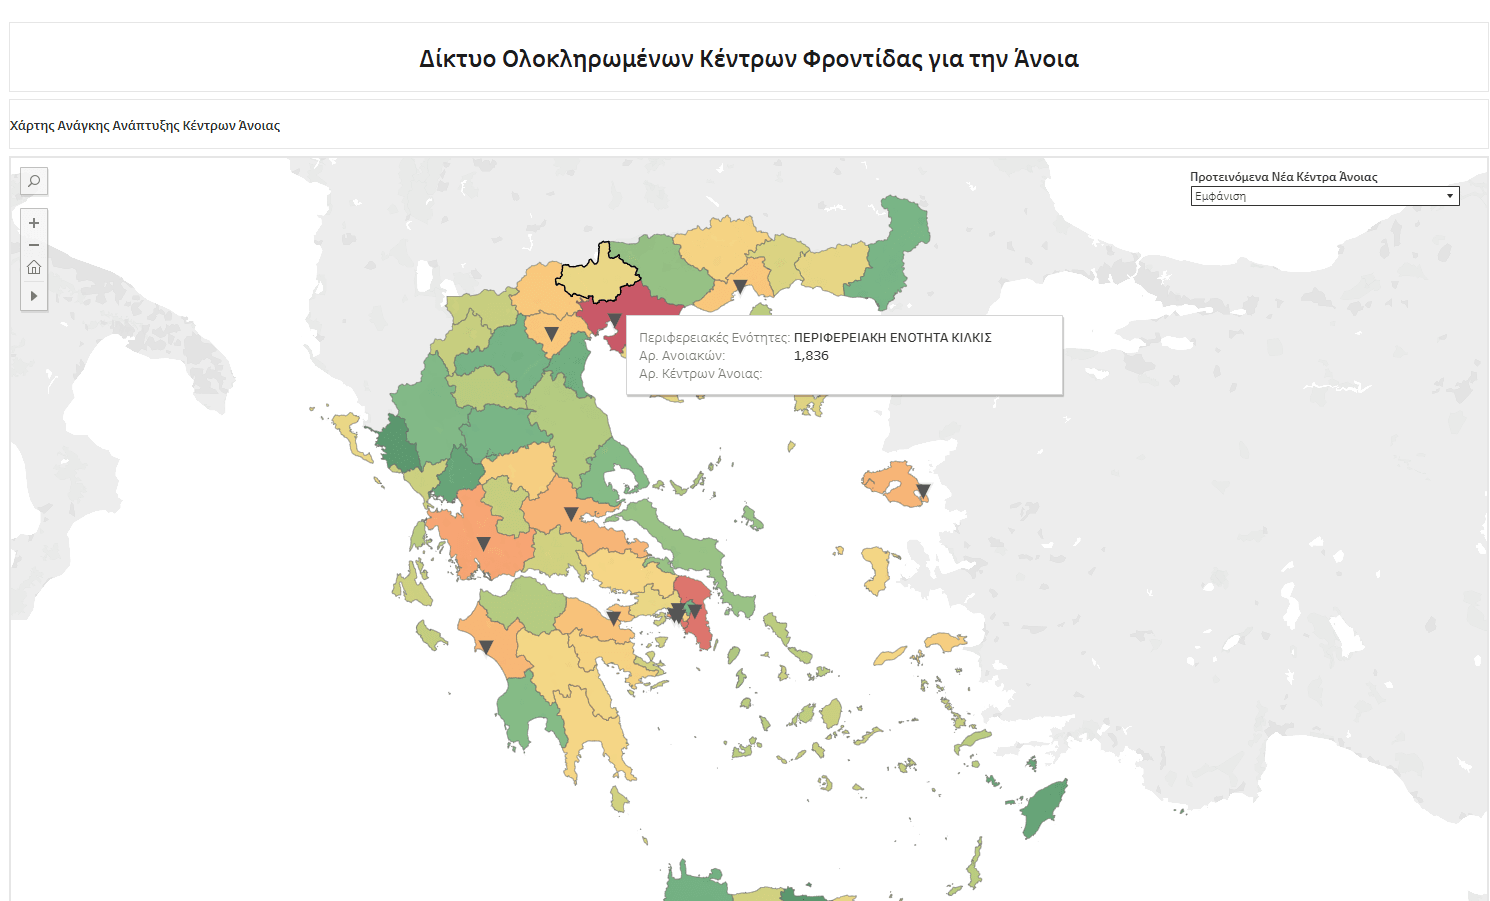
Interactive demo
Dashboard Showcase
Click through the dashboard types below to preview how your users could switch between views, metrics, and analytics in a live environment.
Operational Performance Dashboard
A unified view of targets, completion rates, task flow, and service efficiency.
Operational indicators show strong task completion, with visible delays in two process areas that require management attention.
Why dashboards matter
Built for clarity and better decisions
Real-Time Insights
Access live indicators, trends, and status updates without waiting for manual reports.
Better Decisions
Turn complex information into visual intelligence that supports faster action.
Automated Reporting
Reduce repetitive reporting work with connected, dynamic views.
Centralized Information
Combine multiple data sources into one clear operational environment.
Common use cases
Where these dashboards create value
Get started
Turn your data into a live decision-making tool
Get a branded, interactive dashboard that connects your data sources, automates reporting, and gives your team the real-time visibility they need to act faster.